Garchen Rinpoche Comparing Fine-Tuning Approaches for Tibetan Speech-to-Text: 10-Hour Training Data Optimization
1. Introduction to the Analysis
This report documents our recent speech-to-text models trained on 10 hours of audio data. We explored different base model approaches to find the optimal training strategy:
- Continued fine-tuning - Our general model further trained with 10 hours of additional data
- Progressive fine-tuning - Continuing with 10 hours of training data on a previously fine-tuned model that used 5 hours of training data
- From-scratch training - Fine-tuning a model from scratch using the full 10 hours of training data
For each approach, we evaluated performance using Character Error Rate (CER) as our primary metric, generating comprehensive comparisons across multiple checkpoints to determine the most effective model.
2. Data & Methodology
Our dataset consists of a test dataset containing audio files and reference transcripts. We’ve used the Character Error Rate (CER) metric to evaluate the performance of each model and checkpoint. The models and checkpoints evaluated include:
- Base model
- Fine-tuned v1 (5000, 10000, 19000 steps)
- Fine-tuned v2 (20000, 32000, 43000 steps)
- Fine-tuned v3 (1000, 25000 steps)
- Fine-tuned v4 (22000 steps)
We’ve computed the CER for each file and binned the results to visualize the distribution of errors.
3. CER Statistics: A Bird’s Eye View
Our analysis reveals the following CER statistics for each model and checkpoint. In addition to CER metrics, we include columns for training data hours, training time, epochs run, the finetuning source, and how the checkpoint was selected. Checkpoints (such as 5000, 25000, etc.) were chosen by reviewing the progress graph in Weights & Biases (wandb) and selecting the best-performing model based on CER. If a model showed no progress, we stopped training before reaching 100 epochs.
| Model/Checkpoint | Mean CER | Std CER | Training Data (hrs) | Training Time (hrs) | Epochs Run | Finetune Source |
|---|---|---|---|---|---|---|
| base | 0.277 | 0.161 | 0 | 0 | 0 | wav2vec2 scratch model |
| v1_5000 | 0.274 | 0.182 | 5.6 | 2.15 | 100 | base |
| v1_10000 | 0.234 | 0.172 | 5.6 | 2.15 | 100 | base |
| v1_19000 | 0.229 | 0.172 | 5.6 | 2.15 | 100 | base |
| v2_20000 | 0.223 | 0.175 | 10 | 2.3 | 100 | base |
| v2_32000 | 0.218 | 0.167 | 10 | 2.3 | 100 | base |
| v2_43000 | 0.215 | 0.168 | 10 | 2.3 | 100 | base |
| v3_1000 | 0.234 | 0.176 | 10 | 2 | 61 | v1_19000 |
| v3_25000 | 0.222 | 0.171 | 10 | 2 | 61 | v1_19000 |
| v4_22000 | 0.227 | 0.171 | 10 | 2 | 50 | wav2vec2 scratch model |
4. Visualizations: Bringing the Data to Life
Below are key visualizations generated during the analysis:
CER Comparison Across Models

This bar chart compares the mean CERs of each model and checkpoint, providing a clear visual representation of their performance.
CER Distributions

This distribution plot shows how many files fall into each CER range, giving us a better understanding of the spread of errors.
CER Improvement Percentage Over Base Model
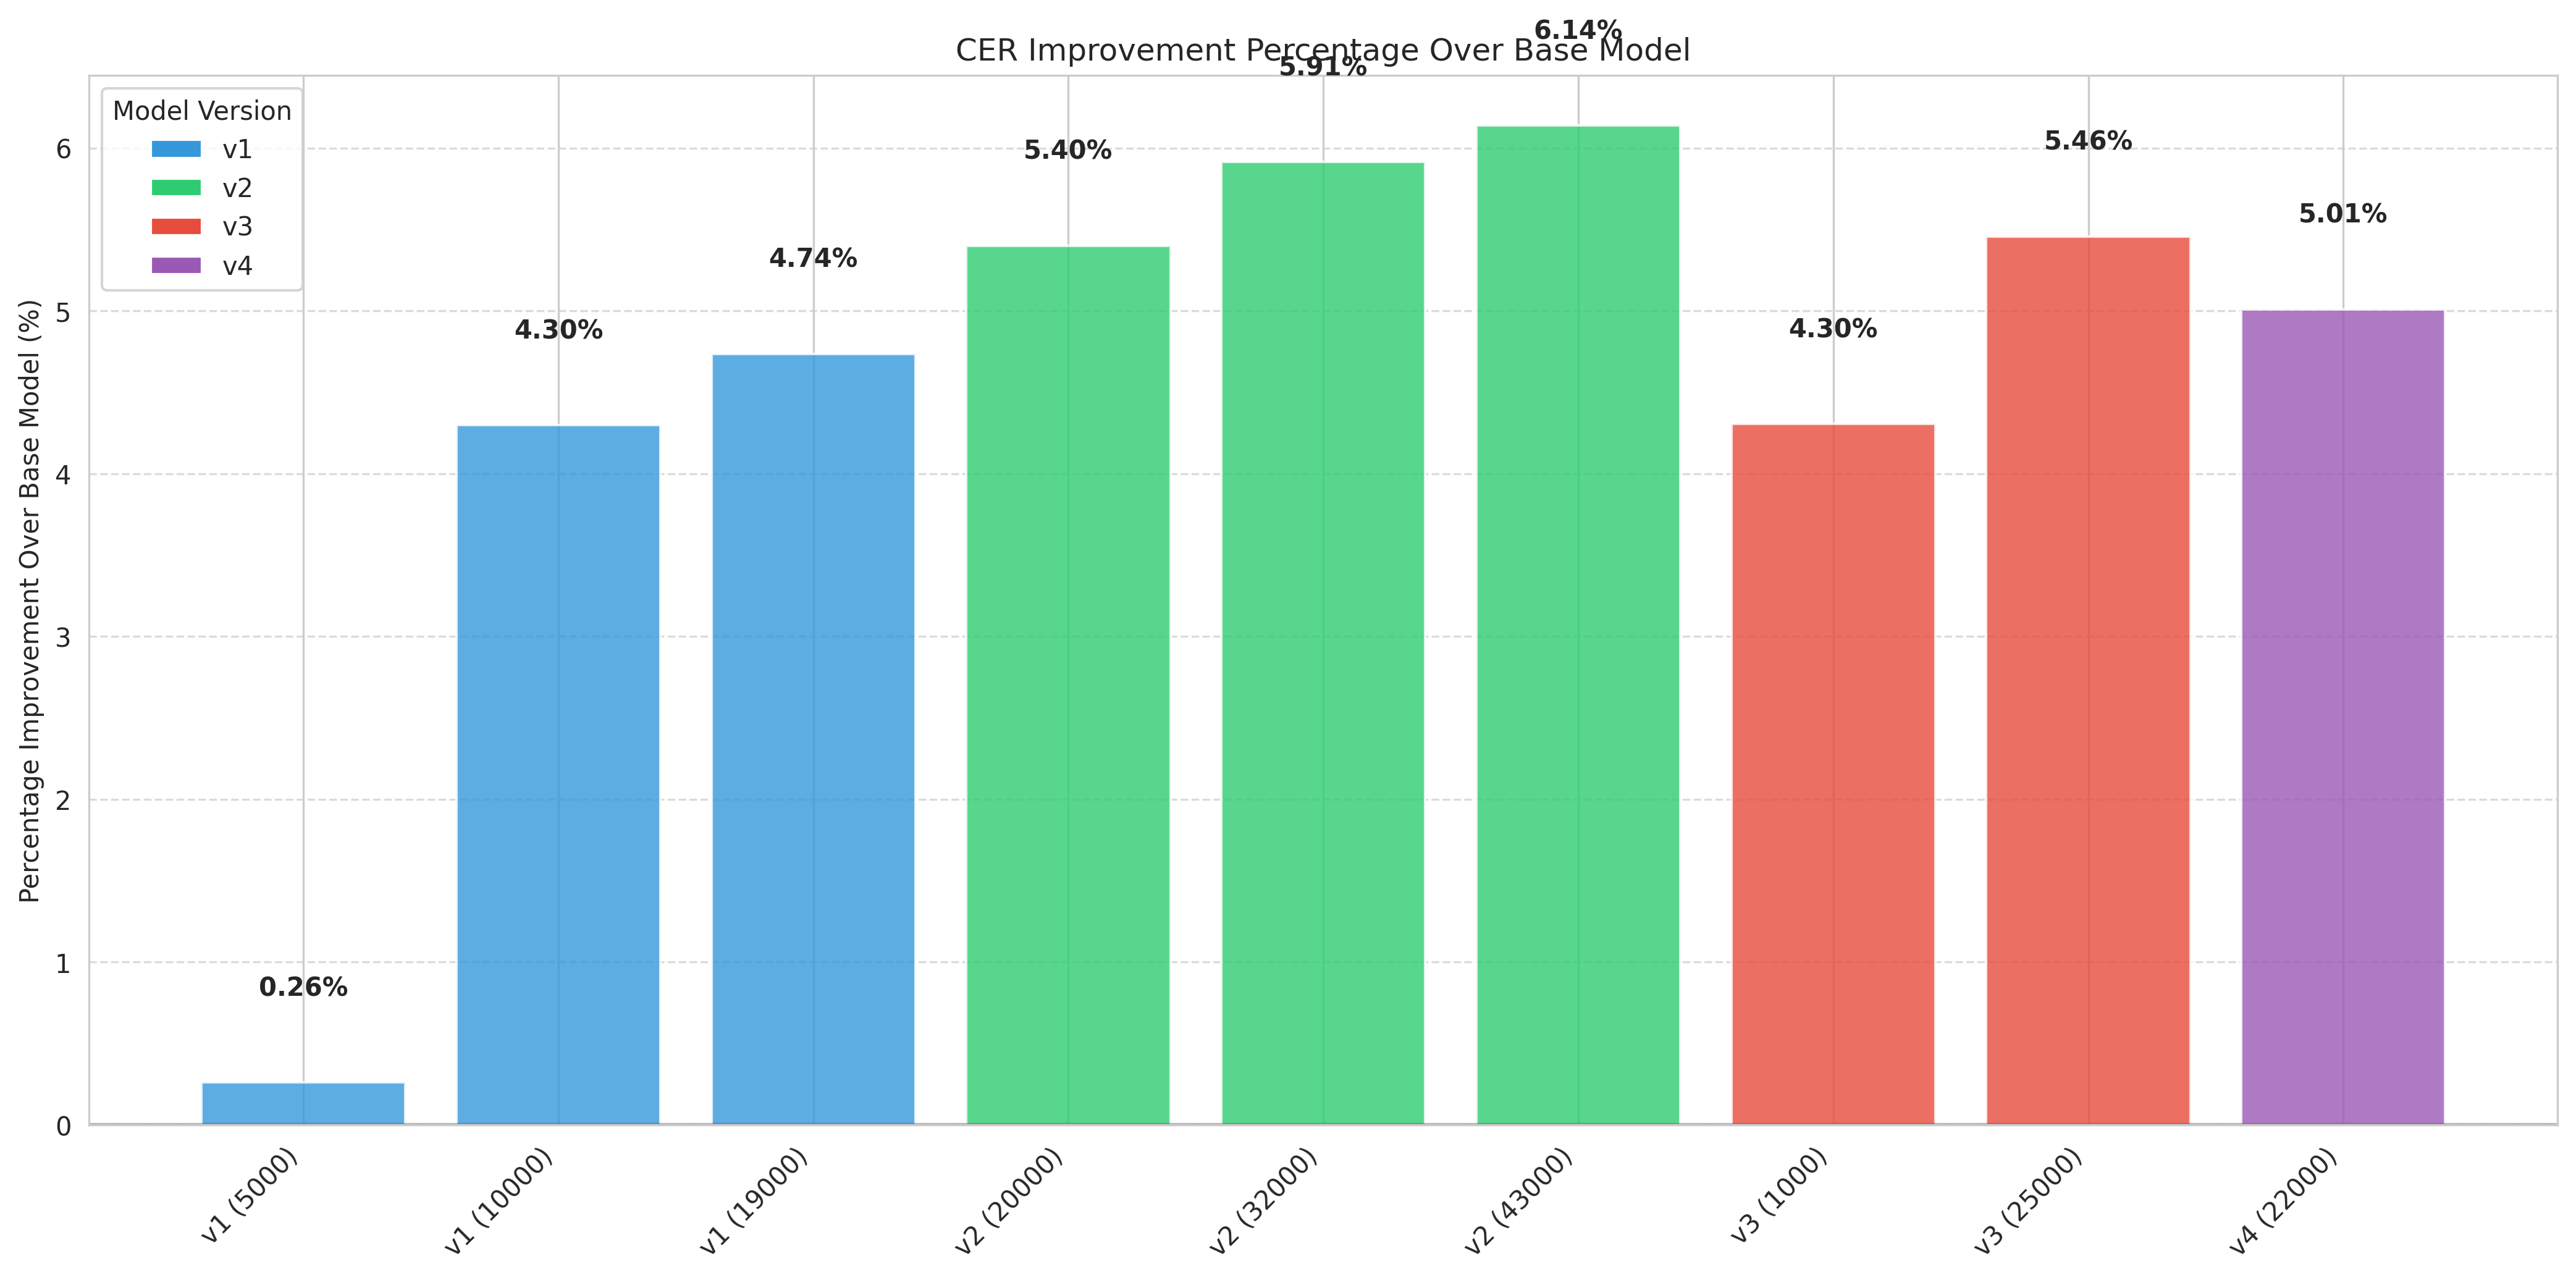
This plot highlights the relative gains over the base model, helping us identify the most improved checkpoints.
Grouped Bar Chart: File Counts in Each CER Bin for Each Model

This grouped bar chart visualizes the count of files in each CER bin for every model and checkpoint. Each group of bars corresponds to a CER bin (e.g., 0.00-0.05, 0.05-0.10, etc.), and each colored bar within a group represents a different model/checkpoint. Taller bars in lower CER bins indicate better model performance.
5. Improvement Analysis: Identifying the Best Performers
The percentage improvement in CER over the base model for each checkpoint is summarized in the improvement plot and table. The best improvement is observed for ft_v2_43000 and ft_v3_25000, which consistently outperform earlier checkpoints and the base model.
6. Conclusion
Our comparative analysis of the three fine-tuning approaches for Garchen Rinpoche’s Tibetan speech-to-text model yields clear results:
-
Continued fine-tuning on base model (v2): This approach, where we continued fine-tuning our general model with 10 hours of training data, yielded the best overall performance with the v2_43000 checkpoint achieving a 0.215 CER. This represents a 22.4% improvement over the base model and shows that building upon a general foundation with targeted data delivers optimal results.
-
Progressive fine-tuning on previously fine-tuned model (v3): Our second approach, continuing fine-tuning with 10 hours on a model previously trained with 5 hours of data (v3_25000), performed nearly as well with a 0.222 CER. This demonstrates that incremental training on progressively larger datasets is also effective.
-
Fine-tuning from scratch (v4): Training from scratch with 10 hours of data (v4_22000) produced respectable results (0.227 CER) but couldn’t match the performance of building upon pre-trained foundations.
Based on these findings, we recommend deploying the v2_43000 checkpoint for production use, as it demonstrates the lowest CER and best distribution of files in the low-error bins. For future Tibetan speech recognition models, we recommend the continued fine-tuning approach, leveraging pre-trained foundations rather than training from scratch, even when working with limited domain-specific data.